Product teams are tasked with building, managing, and prioritizing product roadmaps, all in the name of reducing customer churn and driving acquisition.
How do you get your roadmap right?
Including items asked for by customers is certainly one approach. But, making the right call is challenging when customers ask for very different things.
Instead, we suggest making customers choose. Customers know better than anyone which features are must-haves versus which ones are nice-to-haves. By leveraging their feedback through a product prioritization study, you get objective intel on which features should make your roadmap today, and which ones you can de-prioritize for the future.
What You Win With Data-Driven Product Roadmap Prioritization
We may be preaching to the choir here, but it bears stating. There are several material benefits that come from deliberate and data-driven product prioritization:
- Better Use Of Internal Product & Engineering Teams: Every R&D, product, or engineering team, no matter how big, has finite resources. As a result, you’ll want to leverage their skills in a way that will most benefit your business. Making sure they build and manage the right features does just that.
- Better Customer Acquisition: No product lives in a vacuum. Prospective customers are comparing your product agains the competition. Making sure you build, and release, the features customers want is one of the best ways to improve adoption.
- Better Customer Retention: Customers want to know they are getting the most for their money. Seeing regular releases of relevant features ensures they continue to receive value from your product. And, in turn, continue paying for its use.
In essence, getting the features in your roadmap right is all about optimizing your labor power and your revenue potential.
Prioritizing Roadmaps With MaxDiff Research
Thankfully, there is a very established research protocol for doing any kind of trade-off or prioritization study. Called Maximum Difference Scaling, or MaxDiff for short, this type of study forces respondents to decide which features are most important and least important to them. In doing so, it goes beyond asking them what features they want and instead addresses what features they really want.
By identifying the features customers really want, product teams are empowered to build their roadmaps with the most impactful features.
Let’s break down how this process all comes together.
1. Build The List Of Features For Consideration
You can’t run any kind of product feature prioritization study without first knowing what features to consider. Internal teams have likely been collecting asked-for features on an ad-hoc basis (or, we hope they have). But, don’t dismiss several public channels that might also give insight into features for consideration. These include:
- Online review sites
- Feature request boards
- Competitor roadmaps / press releases
- Online forums
Reviewing all of these channels lets you cast a wide net and ensure that you don’t miss a potentially attractive feature.
2. Pare Down The Features For Consideration
The complete list of potential features could be unwieldy. We suggest paring it down to 15-20 features to make things more manageable. Of course, how you make those decisions is a mix of art and science.
You could make sure to include features requested by your biggest customers. Or, features recently released by competitors. Or, more experimental features that no one is asking for, but you think they should.
Regardless of your approach, be deliberate. And, be sure to build team consensus to ensure buy-in on the final results.
3. Run Your MaxDiff Study
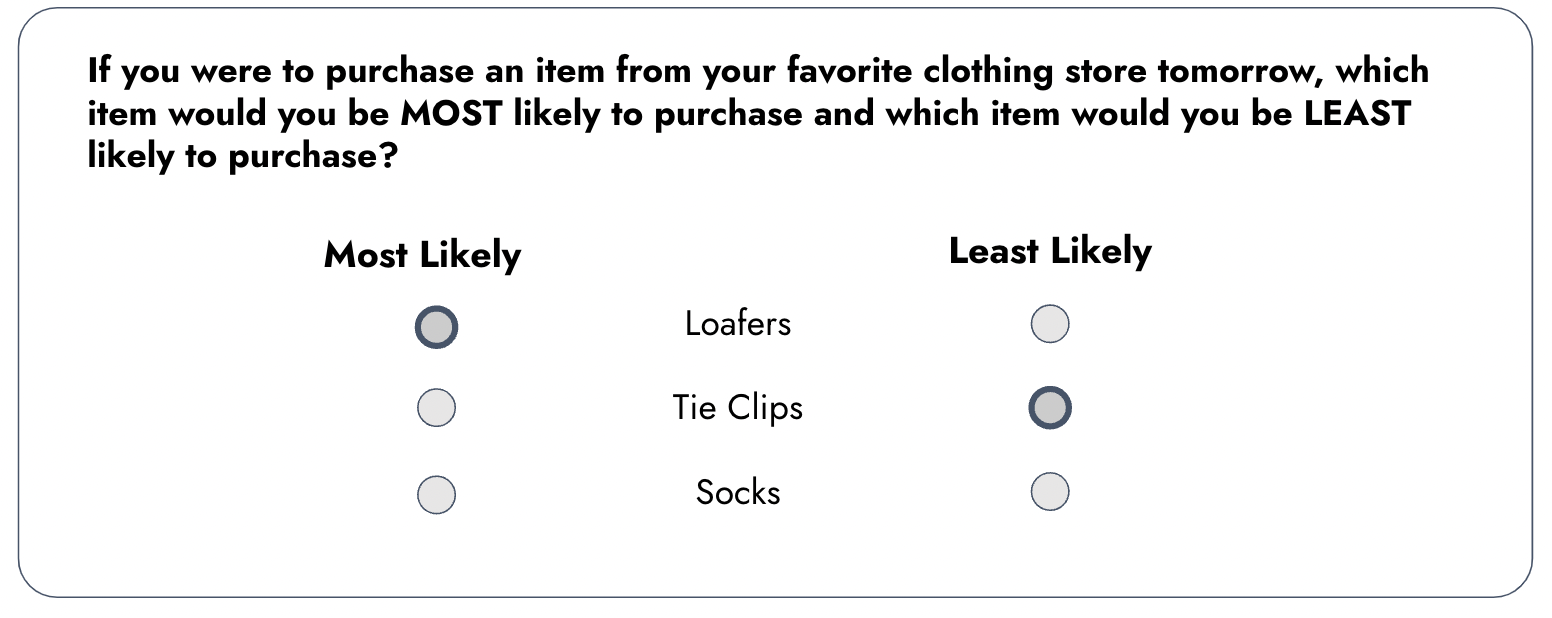
Once you have your final feature set, you’re ready to run them past customers and start collecting the raw data on how they value features against each other. The process for respondents if fairly straightforward. Via a digital survey platform, they see a list of 4-5 features or product choices.
They are asked to select the product or feature that is most important and least important to them. Once done, the screen refreshes. They then see another set of 4-5 features and repeat the same exercise. This process happens several times for each and every respondent. The end result is a collection of data on how respondents trade off one feature against the other.
The image to the right shows a mock-up example for an e-commerce site selecting product categories.

4. Review Your MaxDiff Study Results
Once you collect all of your data, it’s time for the fun part. Looking at how customers prioritize different features. With a MaxDiff study, you get a lot of ways to measure customer trade-offs.
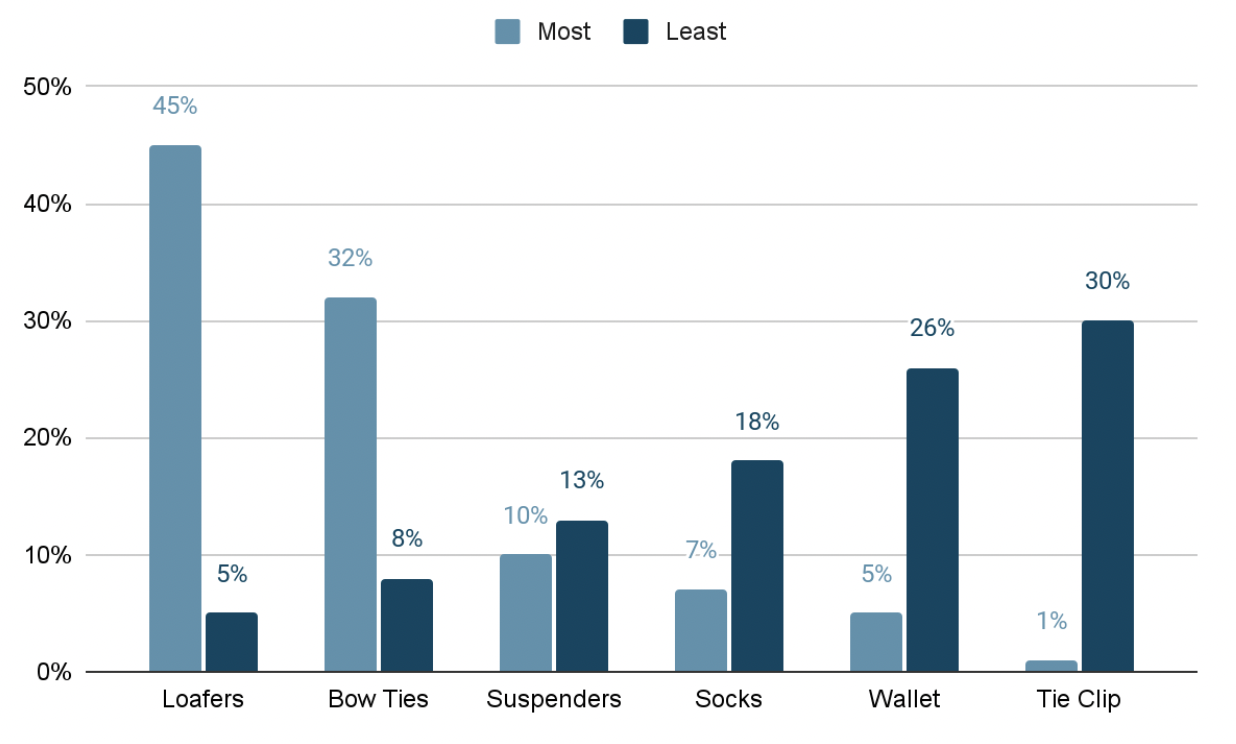
Feature Counts
The most basic way to begin the analysis is looking at Feature Counts. That is, what percentage of the time a feature was selected as most important or least important when it was shown. When we graph this out, we often see the patterns below. One or two features tend to be selected as “Most Important” more often than not. Meanwhile, another set tends to be selected as “Least Important” more than the others.

Preference Share
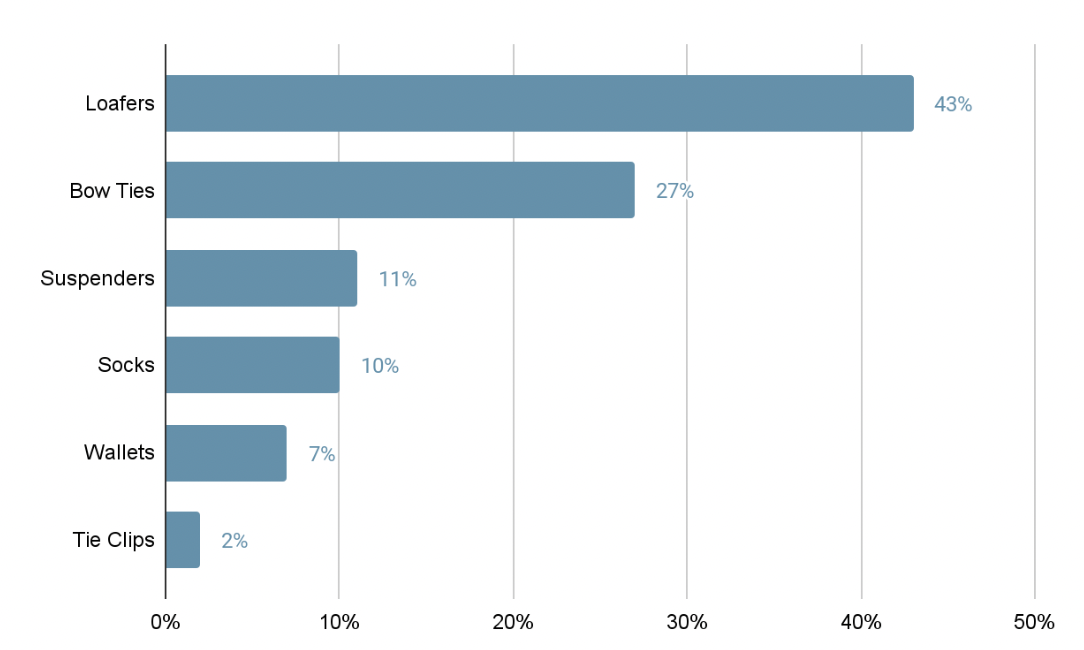
Feature count data takes us to the next valuable finding: Preference Share. Preference share can be understood as the probability that a respondent would choose one item over another if they were asked to select an item from a list.
In essence, this is where we really see how trade-offs will occur. In our mockup example below, we see that Loafers would be selected 43% of the time when given an option while Socks will be selected 10% of the time. Disparities in Preference Share are another way to see how selections would be made in real life.

Average Feature Utility
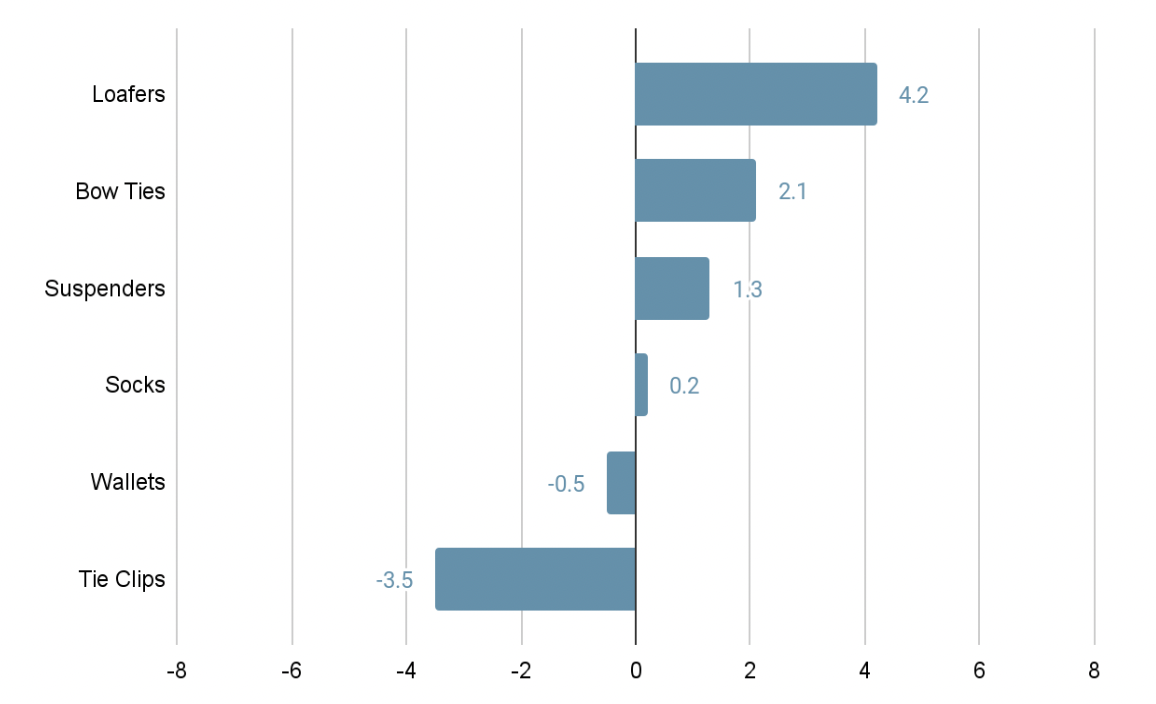
Another powerful output from MaxDiff studies is the Average Feature Utility measure. This number is the average calculation across respondents’ individual utility scores for each feature. The higher a feature’s average utility is, the more often it was selected as most preferred. The more negative the average utility, the more likely it was selected as least preferred.
Looking at this type of graph tells us two things. The further products are from zero, the stronger we know respondents are in wanting or not wanting a given feature. For instance, Loafers are a 4.2. This means they are very strongly preferred on a recurring basis. Meanwhile, Wallets are -.5. This very small but negative utility score tells us that respondents tend to be indifferent to this feature, but when they do have any reaction to it, it’s to rank it as less important.
The further a feature’s utility score is from another feature tells us a similar story. There is a big difference in utility score between Loafers and Bow Ties. This tells us that while they both get selected as “Most Important” several times, Loafers really matter over Bow Ties.

5. Inform Your Product Roadmap Using MaxDiff Data
Once the data is in and graphed, it’s time to build your roadmap.
You might be tempted to just pick the top two or three features from the MaxDiff study and stop there. But, that’s often too simple. That does not take into account the work effort associated with that product or feature.
That’s why we say the MaxDiff data should inform your roadmap, not be the sole basis by which you build your roadmap.
The MaxDiff output gives you a clear picture of what customers want, and how they would prioritize things. In conjunction with this, you’ll need to assess the organizational cost of building and launching those items. This might lead to a balancing act where the #1 most-preferred feature isn’t built because of the organizational cost. But, in its place, the #2 and #3 most-preferred items do make the cut.
What To Always Avoid In your Product Roadmap Prioritization Studies
At this stage, we’ve reviewed all of the items you should include when prioritizing how to build your product roadmap. But, just as there are some things you should always do, there is also something you should never do: Include features you know are a given.
Why avoid this?
Because it’s almost certain that it will unduly sway your results.
Imagine an enterprise software product team hasn’t yet built user permissions into their product. But, for anyone in this setting, it is fairly well understood that User Permissions is a must-have feature for product adoption. And, knowing this, the team plans to include it.
If the team also includes “User Permissions” as a feature for exploration in their study, respondents will undoubtedly choose it as their most-needed feature time and time again. However, the product team already knew this was a must-have. By including it in the study, they have not learned anything new.
As a result, we always suggest removing any features you know are must haves or no-brainers. These should likely be in the short-term roadmap anyway, and it lets product teams test features whose value is less well understood.


