Pricing is one of the most critical decisions businesses make. Price too high and your customers may walk away. Price too low and you leave money on the table. Yet most companies set prices using educated guesses, competitive mimicking, or simple cost-plus formulas.
The stakes couldn’t be higher. A 1% improvement in pricing typically delivers 8-11% improvement in operating profits. That’s likely more than any other lever businesses can pull. Conversely, getting pricing wrong can destroy even the best products.
Consider GoPro’s costly miscalculation with the Hero 4 Session. They launched at $400, dramatically overestimating consumer demand and willingness to pay. After dismal sales, they slashed the price to $200—but the damage was done. Competitors seized the opportunity to gain ground in what was once GoPro’s niche market, contributing to years of financial struggles.
On the other end of the spectrum, Australian construction firms Kell & Rigby and Reed Construction systematically underpriced their bids to win projects. This race-to-the-bottom strategy led to cash flow crises, substandard work quality, client disputes, and ultimately, business collapse.
Bad pricing decisions create a cascade of problems. Prices that are too high drive customers to competitors. Meanwhile prices that are too low erode profitability, damage quality perceptions, and threaten business viability.
Data-driven pricing strategies solve this dilemma. Instead of guessing what customers will pay, these methods reveal actual price sensitivity through systematic research. The result? Prices that maximize revenue while maintaining customer satisfaction. The sweet spot every business seeks but few actually find.
The True Cost Of Bad Pricing
Bad pricing doesn’t just mean missing revenue. It creates cascading problems across your entire business. Here are the major categories of damage.
Revenue & Profitability Impact
- Immediate revenue loss: Netflix lost 800,000 subscribers in one quarter after poorly executed price increases
- Margin erosion: Systematic underpricing destroys profitability even when sales volume increases
- Cash flow crises: Construction firms like Kell & Rigby collapsed from bidding below cost
Competitive Disadvantage
- Market share loss: GoPro’s Hero 4 Session pricing mistake allowed DJI and Garmin to gain permanent footholds
- Price wars: Overpriced products trigger competitive responses that hurt entire industries
- Lost positioning power: Once customers perceive you as overpriced, regaining premium positioning becomes nearly impossible
Brand & Perception Damage
- Quality perception issues: Underpricing signals inferior products to consumers
- Premium brand erosion: Price cuts can permanently damage luxury or premium positioning
- Customer trust loss: Frequent price changes or dramatic adjustments create skepticism about value
Operational Strain
- Resource misallocation: Overpriced products require expensive marketing to justify costs
- Quality compromises: Underpricing forces cost-cutting that damages product quality
- Talent retention problems: Low-margin businesses struggle to pay competitive wages
Customer Relationship Effects
- Acquisition cost increases: Wrong pricing makes customer acquisition more expensive
- Lifetime value reduction: Price-sensitive customers acquired through low pricing often have poor retention
- Support burden: Underpriced products often require more customer service to maintain satisfaction
The data is clear. McKinsey reports that companies with systematic pricing approaches outperform those relying on intuition by 15-25% in profitability metrics. The question isn’t whether you can afford to invest in data-driven pricing. It’s whether you can afford not to.
Data-Driven Pricing Foundations
Moving from intuition-based pricing to systematic, research-driven approaches requires understanding core principles and knowing when these methods deliver the greatest impact.
Core Principles
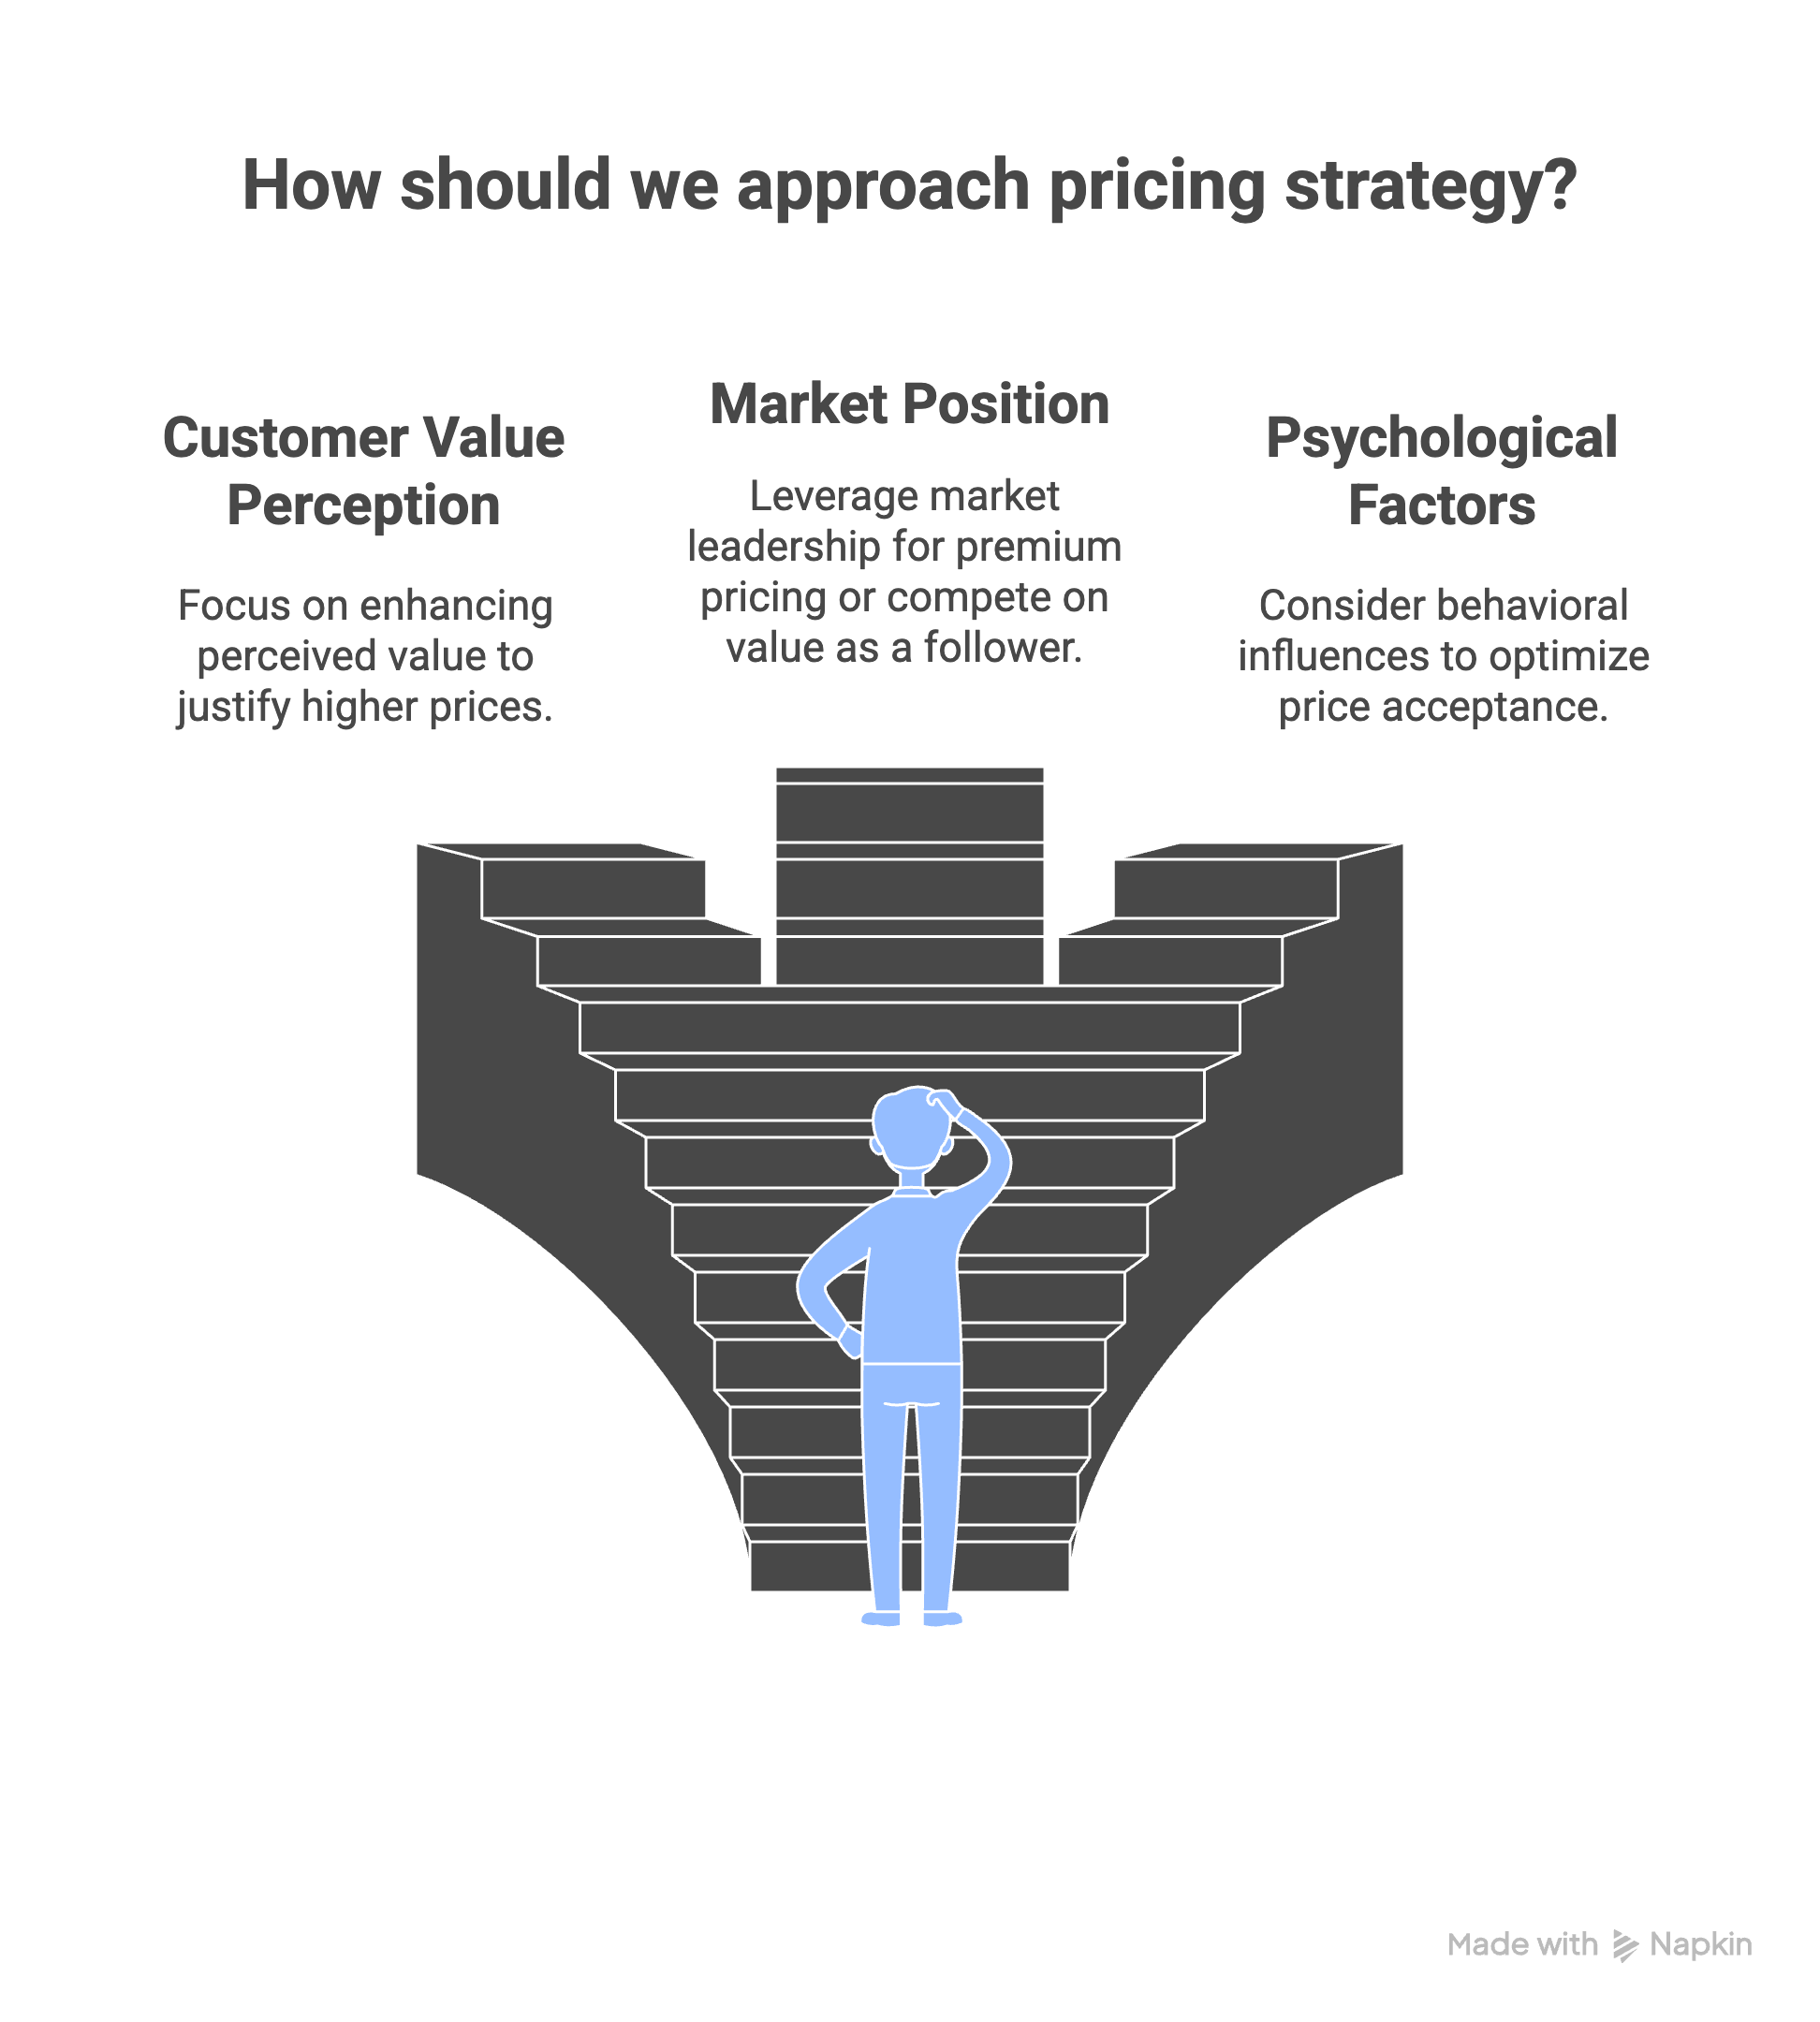
Customer Value Perception Drives Willingness to Pay
Price isn’t determined by your costs. It’s determined by how much value customers believe they’re receiving. A $5 coffee at Starbucks succeeds because customers perceive value in the experience, convenience, and brand association, not because it costs $5 to produce.
Market Position Influences Pricing Power
Your competitive positioning fundamentally affects how much pricing flexibility you have. Market leaders can command premium prices, while followers often compete on value. Understanding your position helps set realistic pricing boundaries.
Psychological Factors Shape Price Acceptance
Customers don’t evaluate prices in isolation. They compare to reference points, respond to anchoring effects, and make emotional decisions about value. Effective pricing research accounts for these behavioral realities.
When to Use Data-Driven Pricing
While pricing research delivers value in most situations, certain scenarios make the investment particularly worthwhile. These high-stakes moments often determine whether a product succeeds or fails in the marketplace:
- New Product Launches: No historical data means you need systematic research to avoid costly pricing mistakes from day one.
- Market Expansion: Customer price sensitivity varies dramatically across geographic markets, demographics, and use cases.
- Competitive Pressure: When competitors change pricing or new players enter your market, data helps you respond strategically rather than reactively.
- Revenue Optimization: Established products often have pricing opportunities hidden in customer segments or usage patterns.
In each of these scenarios, the cost of getting pricing wrong far exceeds the investment in proper research. The question becomes which methodology fits your specific situation and constraints.
Method 1: Van Westendorp Price Sensitivity Meter
The Van Westendorp Price Sensitivity Meter (PSM) remains one of the most reliable methods for identifying customer-acceptable price ranges. Developed in the 1970s, this survey-based approach reveals the psychological boundaries of pricing—from “too cheap to trust” to “too expensive to consider.”
How Van Westendorp Works
The methodology centers on four carefully crafted questions that expose different aspects of price sensitivity. Respondents see your product description, then answer:
- At what price would you consider this product too expensive to buy?
At what price would you consider this product too cheap that you’d question its quality?
At what price would this product be expensive but still acceptable?
At what price would this product be a great value for the price?
These responses create overlapping curves that reveal optimal pricing zones where customer acceptance is highest.
Step-by-Step Implementation
To execute a pricing study using the Van Westendorp method, you’ll need to do the following:
- Survey Design: Write clear, compelling product descriptions that highlight key benefits without revealing intended price ranges. Avoid leading language that might bias responses. Test your description with 5-10 people before full deployment.
- Sample Requirements: Target 300-500 respondents who match your ideal customer profile. Larger samples provide more reliable data, especially when segmenting results by demographics or usage patterns.
- Data Collection: Collect feedback from individuals that meet your target profile. Through the process, be sure to monitor response quality to make sure only high quality responses stay in your sample.
- Analysis: Plot the cumulative frequency curves for each question to reveal the optimal price point.
The Van Westendorp In Action
Imagine a company launching a new premium coffee maker designed for tech-savvy coffee enthusiasts. This product features Wi-Fi connectivity, a sleek modern design, and customizable brewing settings. The company must determine the price point that maximizes revenue without alienating potential buyers.
After running potential buyers through the study, the results show:
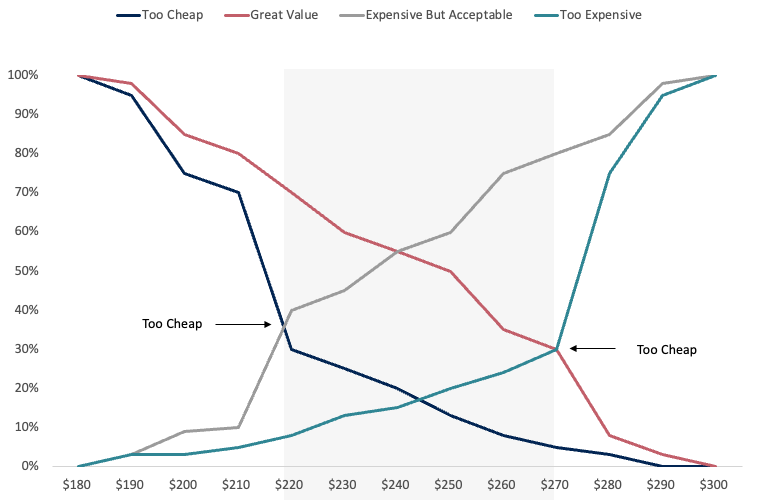
- Most respondents feel the coffee maker starts to feel “expensive” at $270
- Prices below $220 result in questioning quality and authenticity
- The sweet spot emerges in the $220-$270 range
Overlaying cost data reveals production costs of $110 per unit. At $270, gross margins reach 59%. At $250, margins drop to 56%. Since both price points exceed the company’s 50% margin threshold, they both meet acceptable launch thresholds. But, the Van Westendorp data would push them to select a $250 price point to maximize revenue while staying comfortably below the “too expensive” threshold.
Key Benefits & Limitations
Strengths of The Van Westendorp Pricing Method:
- Identifies acceptable price ranges quickly and cost-effectively
- Reveals quality perception thresholds that pure cost-plus pricing misses
- Works across product categories and market types
- Provides clear visual data that’s easy to communicate to stakeholders
Limitations Of the Van Westendorp Pricing Method:
- Doesn’t account for competitive alternatives or market context
- Relies on hypothetical scenarios rather than actual purchase behavior
- Limited insight into price elasticity—how demand changes with price variations
- May not capture complex value propositions with multiple features
Van Westendorp works best as an initial pricing exploration tool. It establishes the broad boundaries of acceptable pricing, but additional methods like Gabor-Granger or conjoint analysis often provide the precision needed for final pricing decisions.
Method 2: Gabor-Granger Model
The Gabor-Granger model takes pricing research a step further by revealing the relationship between price and purchase likelihood. Unlike Van Westendorp’s focus on acceptable price ranges, Gabor-Granger shows exactly how demand changes at different price points—critical intelligence for maximizing revenue.
How Gabor-Granger Works
This method presents respondents with a series of price points for the same product, asking a simple question at each level: “Would you buy this product at $X?” The resulting data reveals price elasticity—how sensitive customers are to price changes—and identifies the optimal point where price multiplied by demand generates maximum revenue.
The beauty lies in its simplicity. Rather than asking customers to think abstractly about price acceptability, you’re measuring concrete purchase intent across a realistic price spectrum.
Step-by-Step Implementation
- Price Range Selection: Start with a broad range spanning 50% below to 100% above your expected price. Include 8-12 specific price points to capture demand curves accurately.
- Survey Design Considerations: Present prices in random order to avoid anchoring bias. Include realistic product descriptions and context. Consider showing competitive alternatives to simulate real decision-making environments.
- Sample Size Requirements: Target 200-300 qualified respondents minimum. B2B products may need larger samples due to smaller total addressable markets and higher variability in willingness to pay.
- Analysis: Calculate demand percentage at each price point. Multiply price by demand to estimate revenue potential. Look for the price point where total revenue peaks. This typically represents your optimal pricing strategy.
Consider segmenting results by customer demographics, usage patterns, or firmographics for B2B products. Different segments often show dramatically different price sensitivity.
Gabor Granger In Action
Let’s say you’re preparing to launch a premium skincare product. Using the Gabor-Granger model, you survey potential customers with price points ranging from $30 to $80.
The data yields the following results:
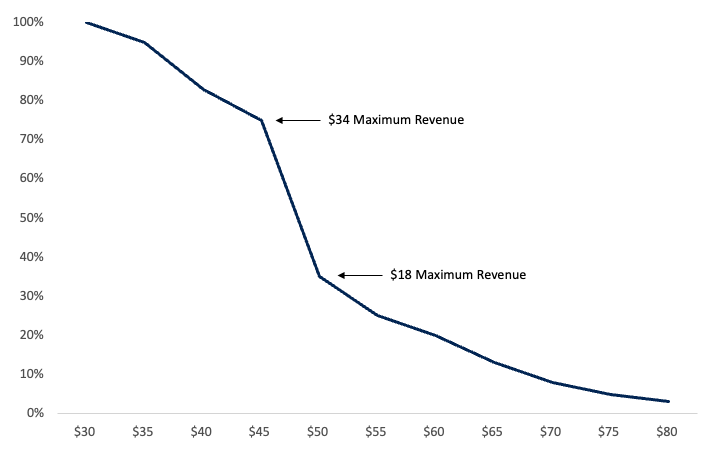
At $30: 95% purchase intent
At $45: 76% purchase intent
At $50: 36% purchase intent
At $65: 20% purchase intent
At $80: 5% purchase intent
Revenue calculations showed the dramatic impact of the $45-$50 threshold:
$45 price point: 76% demand × $45 = $34 revenue per 100 prospects
$50 price point: 36% demand × $50 = $18 revenue per 100 prospects
Despite the modest $5 price difference, revenue drops materially due to demand elasticity. The company should choose the $45 pricing to deliver both strong demand and healthy margins.
Key Benefits & Limitations
Strengths Of The Gabor Granger Method:
- Reveals actual price elasticity curves, not just acceptable ranges
- Identifies revenue-maximizing price points with mathematical precision
- Accounts for the reality that small price changes can dramatically impact demand
- Provides clear ROI calculations for pricing decisions
Limitations Of The Gabor Granger Method:
- Still relies on stated intent rather than actual purchase behavior
- Doesn’t account for competitive responses or market dynamics
- May not capture complex purchase processes involving multiple decision-makers
- Limited insight into feature-specific value perceptions
Gabor-Granger excels when you need precise demand forecasting at different price points. It’s particularly valuable for products with clear value propositions where price is a primary purchase driver.
Method 3: Conjoint Analysis for Pricing
When customers evaluate products, they rarely consider price in isolation. They weigh features, benefits, brand reputation, and price simultaneously, making complex trade-offs that simpler pricing methods can’t capture. Conjoint analysis reveals these hidden preferences, showing exactly how much customers value different features relative to price.
This method becomes essential when pricing products with multiple attributes—software with different feature tiers, cars with various options, or services with different service levels. Instead of asking customers what they’d pay for your complete offering, conjoint analysis shows what drives their willingness to pay.
How Conjoint Analysis Works
Respondents evaluate different product configurations, each combining various features at different price points. Rather than directly asking about price sensitivity, the method forces trade-off decisions that mirror real purchase behavior.For example, customers might choose between:
- Option A: Basic features, premium support, $199
- Option B: Advanced features, standard support, $299
- Option C: Basic features, standard support, $149
Through multiple comparisons, conjoint analysis calculates the relative importance of each attribute—including price—and reveals optimal feature-price combinations.
Step-by-Step Implementation
- Attribute Selection: Identify 4-6 key product attributes that influence purchase decisions. Include 2-4 levels for each attribute, ensuring realistic combinations. Price should be one attribute with 3-4 levels spanning your expected range.Common attributes beyond price include:
- Feature functionality (basic, standard, premium)
- Service levels (self-service, email support, phone support)
- Brand/quality indicators (economy, standard, premium)
- Delivery/timing options (standard, expedited, immediate)
- Survey Design: Use specialized conjoint software to generate statistically efficient choice sets. Most studies require at least six choice tasks per respondent to generate reliable individual-level preferences. Present realistic scenarios that customers actually face. Include competitive alternatives or “none of the above” options to simulate real market conditions.
- Analysis: Calculate utility scores for each attribute level to understand what features drive the most value, how much customers will pay for specific upgrades, and price sensitivity relative to feature preferences.
Conjoint Analysis In Action
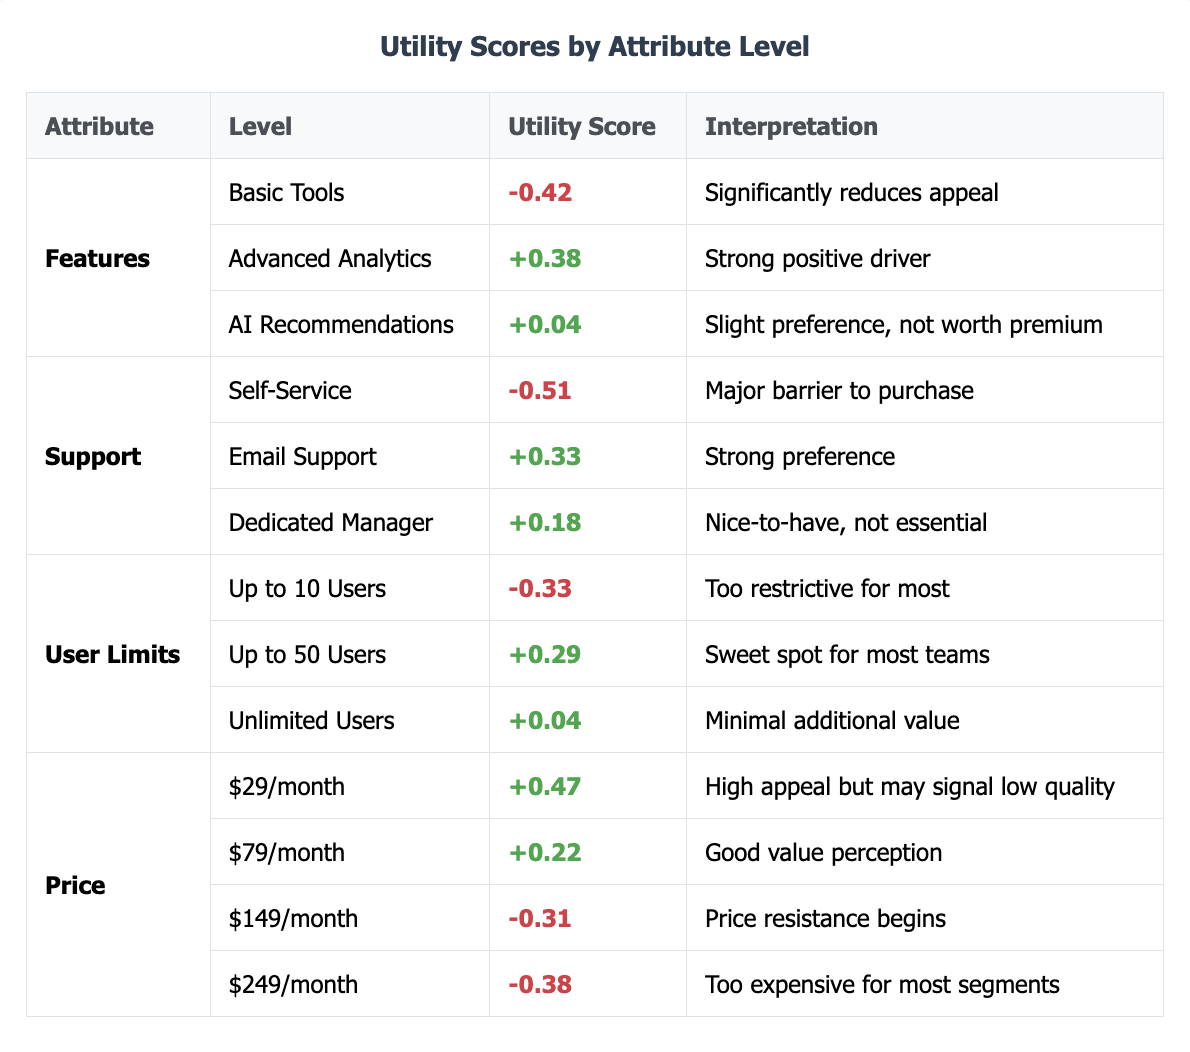
Consider a B2B SaaS project management software company trying to understand how best to set their pricing across three service tiers. They tested combinations of:
- Features: Basic tools, Advanced analytics, AI recommendations
- Support: Self-service, Email support, Dedicated success manager
- Users: Up to 10, Up to 50, Unlimited
- Price: $29, $79, $149, $249 per month
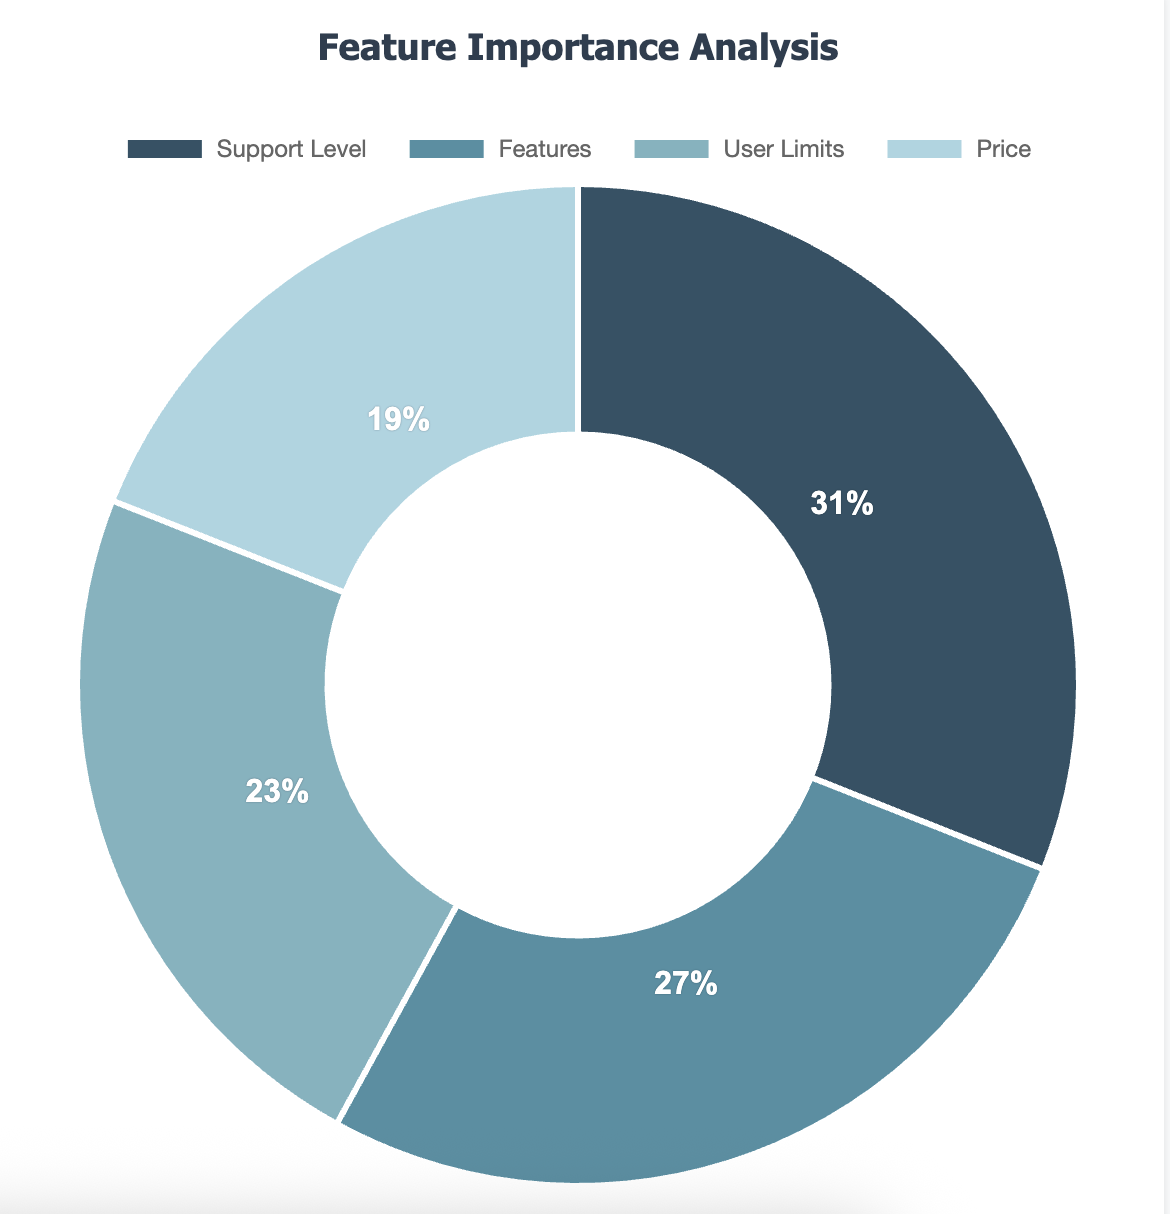
The data shows:
- Customers value dedicated support more than advanced features
- While price plays a role in product selection, it is not as important has user access, features, or support.
Further, when individual feature levels are reviewed, the data shows:
- The jump from 10 to 50 users created significantly more value than 50 to unlimited
- AI recommendations are important but not worth large price premiums
- A Sweet spot at $129: Advanced analytics + Email support + 50 users
In this example, the most basic, lower cost packaging should focus on self-serve options for limited users while the most expensive package should include AI Recommendations and a dedicated manager. This naturally pushes customers to the middle-tier, a classic B2B SaaS pricing approach.
Key Benefits & Limitations
Strengths Of Conjoint Analysis:
- Reveals the relative value of features versus price
- Identifies optimal product configurations for different market segments
- Accounts for realistic trade-off decision-making
- Enables sophisticated market simulation and competitive modeling
- Provides guidance for both pricing and product development
Limitations Of Conjoint Analysis:
- More complex and expensive than simpler pricing methods
- Requires specialized statistical expertise for proper analysis
- Can overwhelm respondents if too many attributes are tested
- Results depend heavily on realistic attribute selection and level definition
- May not capture emotional or brand-driven purchase factors
Conjoint analysis works best for complex products where feature-price trade-offs drive purchase decisions. It’s particularly valuable when you need to optimize both product configuration and pricing simultaneously.
Data Driving Pricing Implementation Framework: Step-by-Step Process
Moving from pricing theory to actual implementation requires a structured approach. While timelines vary depending on product complexity and research scope, following these sequential phases ensures reliable results and actionable insights.
Phase 1: Research Planning
Define Pricing Objectives: Start by clarifying what you’re trying to achieve. Are you launching a new product, optimizing existing pricing, or responding to competitive pressure? Different objectives require different research approaches and success metrics.
Choose Appropriate Methods: Match research methods to your specific situation. Van Westendorp works well for initial price range exploration. Gabor-Granger reveals demand elasticity for established products. Conjoint analysis handles complex feature-price trade-offs. Most comprehensive studies combine multiple approaches.
Budget Allocation
Professional pricing research typically costs $15,000-$50,000 depending on methodology complexity and sample requirements. B2C studies with general population audiences are on the lower. B2B studies are always more expensive due to needing to source more expensive participants.
Timeline Development: Build realistic project schedules accounting for survey design iteration, sample recruitment challenges, and stakeholder review cycles. Complex B2B studies often take longer due to difficult-to-reach respondents and multiple decision-makers.
Phase 2: Data Collection
Survey Deployment Best Practices: Launch with a small pilot (20-30 respondents) to identify survey issues before full deployment. Test across devices and browsers.
Sample Recruitment Strategies: Depending on the target respondent, the study could leverage consumer panels, industry associations, LinkedIn outreach, or highly custom recruitment approaches.
Offer appropriate incentives: This is usually $5-15 for consumer surveys, $50-100 for B2B executives. Send reminder emails at strategic intervals. Optimize for mobile completion since many respondents use smartphones.
Phase 3: Analysis & Insights
Analysis Techniques: For Van Westendorp, plot cumulative frequency curves and identify intersection points. For Gabor-Granger, calculate revenue optimization curves. Conjoint analysis requires advanced statistical modeling
Creating Executive-Ready Reports: Focus on actionable insights rather than methodology details. Lead with recommended price points and expected business impact. Use clear visuals. Charts often communicate better than tables.
Actionable Recommendation Development: Translate research findings into specific business recommendations. Don’t just report optimal prices. Explain implementation implications, competitive responses, and potential risks. Include alternative scenarios for different business objectives.
Common Pricing Research Pitfalls & How to Avoid Them
Even well-intentioned pricing research can produce misleading results if common mistakes aren’t anticipated and prevented. These pitfalls often seem minor during research design but can fundamentally compromise your findings.
Sample Bias Issues
Surveying only existing customers, loyal brand advocates, or easily accessible respondents creates skewed results that don’t represent your true market. Existing customers already demonstrated willingness to pay your current prices. They’re inherently less price-sensitive than prospects evaluating you for the first time.
How to Avoid It: Include prospects who’ve never purchased from you alongside current customers. For B2B research, recruit from industry associations, not just your CRM. Use professional panels or research firms to access truly representative samples. Segment results by customer status to identify different price sensitivities.
Survey Design Mistakes
Leading questions, unrealistic scenarios, or overwhelming complexity produce artificial responses that don’t predict actual buying behavior. For instance, questions like “Would you pay $X for this amazing, industry-leading product?” bias responses upward. Presenting products without competitive context creates unrealistic purchase scenarios. Or, testing too many price points or features overwhelms respondents.
How to Avoid It: Use neutral language in product descriptions. Present realistic competitive alternatives in conjoint studies. Limit Van Westendorp studies to 4-6 price points maximum. Pilot test surveys with internal teams to identify confusing or leading elements before full deployment.
Analysis Interpretation Errors
Misreading statistical outputs, ignoring confidence intervals, or over-interpreting small differences leads to poor pricing decisions. For instance, small sample sizes make results appear more definitive than they actually are. Or, segmentation analysis with tiny subgroups produces unreliable insights.
How to Avoid It: Require minimum 50 respondents per segment for meaningful analysis. Or, if you must use small sample sizes, be careful to communicate their limitations.
Implementation Challenges
Research recommendations may conflict with operational constraints, competitive dynamics, or internal politics, preventing successful implementation. For instance, optimal pricing might require new billing systems, sales training, or customer communication strategies that weren’t considered during research. Recommended prices might trigger competitor responses that weren’t modeled.
How to Avoid It: Include operations, sales, and finance stakeholders in research planning. Test implementation scenarios before committing to recommendations. Model competitive response scenarios during analysis. Build change management plans alongside pricing recommendations.
Change Management Considerations
Even perfect research fails if internal teams resist pricing changes or customers aren’t properly prepared for transitions. Sales teams may fear higher prices will hurt their numbers while customer success teams worry about retention. Or, marketing struggles to communicate value at new price points. Additionally, if customers receive price increases without adequate explanation, you may cause churn.
How to Avoid It: Involve all affected teams in research design and result interpretation. Provide sales teams with value-selling tools and objection-handling guidance. Create customer communication strategies that emphasize value improvements alongside price changes. Consider grandfathering existing customers during transition periods.
Timing and Market Context Failures
Research conducted during unusual market conditions or too far in advance of launch produces unusual or outdated insights. This includes conducting research during economic uncertainty, seasonal peaks, or major industry disruptions as well as conducting research over one year before a product launch.
How to Avoid It: Consider market timing when interpreting results. Update research if major market changes occur before implementation. Build scenario planning into analysis. Test results under different economic or competitive conditions.
The key to avoiding these pitfalls lies in recognizing that pricing research is as much art as science. Statistical precision means nothing if the underlying assumptions, sampling, or implementation approach are flawed. Successful data driven pricing research requires skepticism about your own methods and constant validation against real-world results.
Data Driven Pricing Strategy FAQs
In what situations might Van Westendorp and Gabor-Granger pricing recommendations conflict, and how should a business resolve that?
Conflicts can arise when Van Westendorp’s acceptable price range is narrower or lower than the Gabor-Granger’s revenue-maximizing price. This usually happens if the Gabor-Granger test identifies that a smaller but high-value segment is willing to pay more, while Van Westendorp reflects a broader audience preference. Resolution entails layering findings: use Van Westendorp to set boundaries, but lean on Gabor-Granger for target revenue optimization—especially if profitability trumps volume.
How can margin requirements alter the “ideal” price suggested by customer survey data?
If a business’s breakeven or required profit margin falls above the customer-acceptable range, as revealed by the Van Westendorp, it may need to reengineer costs, reposition the offering, or target more premium segments before proceeding. Survey data should always be cross-referenced with cost structure before finalizing pricing decisions.
What adjustments should be made to pricing models for highly innovative or niche products?
For novel solutions, customers lack reference points and may anchor on unrelated products, producing unreliable survey results. It’s essential to provide robust education about the unique benefits and to triangulate pricing signals from small-scale launches, pilot sales, and in-depth interviews, rather than rely solely on standard survey methodologies.
How does competitive pricing research change if your competitors are also using dynamic, data-driven approaches?
If rivals also adjust prices dynamically, your competitive benchmarks become moving targets. This necessitates frequent market monitoring, real-time price comparisons, and more agile internal approval processes—a static annual pricing review isn’t sufficient. Sometimes, automated pricing models and advanced analytics are required to keep pace.
How should companies address large price perception gaps between target segments surfaced in pricing surveys?
Where segments diverge widely on acceptable price, consider differentiated offerings (good-better-best tiers), segment-targeted promotions, or even white-label/alternative branding strategies to capture more share while meeting each group’s willingness to pay.
When should a business prioritize market positioning (premium/value) over maximizing possible demand in pricing?
For brands seeking exclusivity, loyalty, or high-margin leadership, setting a premium price may be strategically wiser than maximizing short-term volume. This approach works for novel, luxury, or highly differentiated products.
How can conjoint analysis reveal trade-offs that pricing-only techniques might miss?
Conjoint analysis models real-world purchasing by forcing respondents to weigh price against specific features or benefits. This uncovers which attributes customers will pay for and where price elasticity is lowest—crucial insight for optimizing bundled offers or innovation investment.
What actionable steps can be taken if your breakeven cost falls outside of the Van Westendorp “sweet spot” range?
Possible paths include revisiting production costs, enhancing perceived value (better branding, story, or features), prioritizing high-value segments, or bundling with complementary offerings.
In which scenarios would you recommend running both Van Westendorp and Gabor-Granger, rather than just one?
Use both when launching new offerings without historic sales data, especially in diverse markets or with unclear price sensitivity. Van Westendorp identifies acceptable boundaries, while Gabor-Granger fine-tunes for revenue, capturing both breadth and depth of willingness to pay.
How might external factors (inflation, sudden supply shocks) throw off data-driven pricing models, and what can be done to mitigate this risk?
Inflation or supply shocks can quickly push costs or customer price tolerance outside surveyed ranges. Build in contingency plans for periodic research updates, dynamic repricing, and “trigger” thresholds that auto-initiate a review if costs or demand shift sharply.
What are early-warning indicators, post-launch, that your data-driven pricing needs immediate reconsideration?
Watch for rapid sales declines, high abandonment rates at checkout, increases in discount/redemption requests, unfavorable social or product reviews mentioning “too expensive,” or competitor price undercutting. Consistently monitor actual sales against model forecasts to catch misalignments quickly.


